How to Use Xbox Cloud Gaming: Features, Benefits, and Compatible Devices
Estimated reading time: 12 minutes
Xbox Cloud Gaming represents Microsoft’s revolutionary approach to gaming accessibility, eliminating traditional hardware barriers through advanced cloud streaming technology. This comprehensive gaming service enables you to access a vast library of premium games instantly across multiple devices without requiring expensive console purchases or lengthy downloads.
The cloud gaming market has experienced exponential growth of 47.4% annually since 2020, with Xbox Cloud Gaming positioning itself as a leading solution for modern digital entertainment needs. Whether you’re a business professional seeking flexible entertainment options during downtime or an entrepreneur evaluating cost-effective technology solutions, understanding Xbox Cloud Gaming’s capabilities becomes essential for making informed decisions about digital entertainment investments.
If you’re interested in a broader perspective on how cloud technologies are revolutionizing different industries, including gaming and entertainment, you may want to read about Amazon Web Services’ impact on global business.

Key Takeaways
– Stream over 400 games instantly to mobile, PC, and TV—no console required
– Subscription-based model with Xbox Game Pass Ultimate ($16.99/month in the US)
– Supports cross-platform play and game progress syncing via cloud saves
– Works with most Bluetooth controllers and offers touch controls for mobile
– Requires stable internet (10–20 Mbps+); performance depends on connection quality
– Integration with Game Pass, EA Play, and Microsoft’s gaming ecosystem
– Strong alternative to traditional consoles for flexible, cost-effective gaming

Table of Contents
• What Is Xbox Cloud Gaming?
• Key Features Of Xbox Cloud Gaming
• How To Access Xbox Cloud Gaming
• Technical Requirements
• Xbox Cloud Gaming Vs. Console Gaming
• Mobile Gaming Experience
• Game Pass Integration
• Performance Analysis
• Expert Tips For The Best Experience
• Is Xbox Cloud Gaming Worth It?
• Comparison With Competitors
• Future Of Xbox Cloud Gaming
• FAQ: Common Questions Answered

What Is Xbox Cloud Gaming?
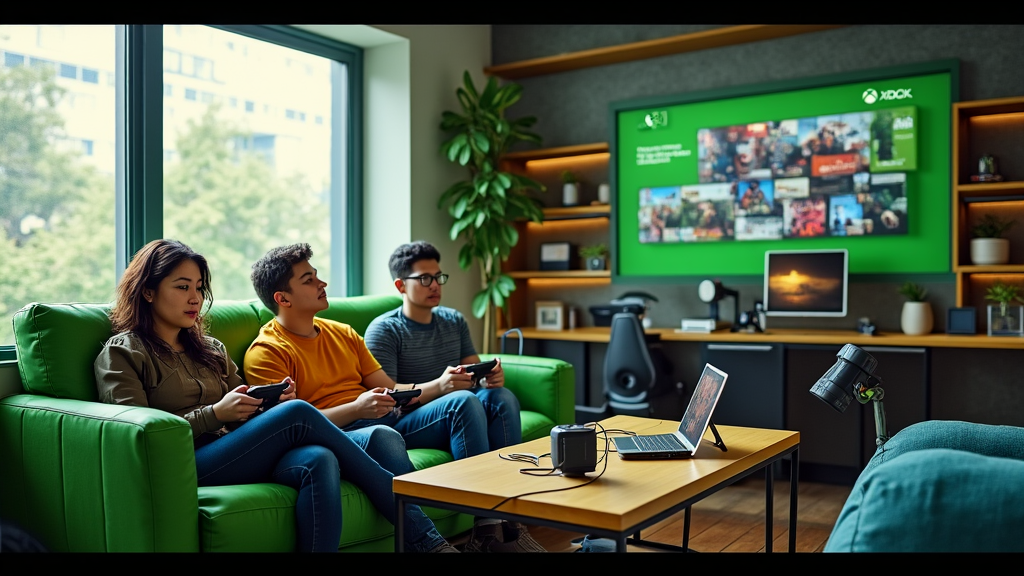
Xbox Cloud Gaming is Microsoft’s cloud-based gaming service that streams high-quality video games directly to your devices through internet connectivity. Originally launched as Project xCloud in 2019, this service has evolved into a comprehensive gaming platform offering over 400 premium titles accessible without traditional console hardware requirements.
The service operates by running games on Microsoft’s powerful cloud servers, streaming the video output to your device while processing your controller inputs in real time. This technology enables you to play demanding AAA titles on smartphones, tablets, laptops, and smart TVs that would otherwise lack the processing power for such experiences.
In 2025, Xbox Cloud Gaming serves over 25 million active subscribers globally, making it one of the most significant cloud gaming platforms available. The service integrates seamlessly with Xbox Game Pass Ultimate subscriptions, providing exceptional value for users seeking diverse entertainment options.
To see how other cloud-powered platforms, like AWS, are transforming digital services, check out this resource.

Evolution Of The Service
Xbox Cloud Gaming originated from Microsoft’s Project xCloud initiative, which began development in 2018 as an experimental cloud streaming platform. The service launched its public preview in September 2020, initially supporting 50 games on mobile devices running Android operating systems.
Major technological enhancements occurred throughout 2021 and 2022, including the transition from Xbox One S server blades to more powerful Xbox Series X hardware in Microsoft’s data centers. This upgrade increased streaming quality to 1080p resolution at 60 frames per second, significantly improving visual fidelity and responsiveness for users.
The integration with PC and browser platforms expanded accessibility dramatically, allowing users to access games through web browsers without requiring dedicated applications. Recent developments in 2024 and 2025 have focused on reducing input latency to under 50 milliseconds and expanding global server coverage to 30+ countries.

Key Features Of Xbox Cloud Gaming
Xbox Cloud Gaming offers comprehensive gaming capabilities that distinguish it from traditional gaming setups. The service provides instant access to a substantial library containing over 400 games, including popular titles such as Halo Infinite, Forza Horizon 5, and Microsoft Flight Simulator.
Cross-device compatibility enables seamless gaming experiences across smartphones, tablets, PCs, and smart TVs without requiring separate game purchases for each platform. Your gaming progress synchronizes automatically through cloud saves, allowing you to start playing on one device and continue on another without losing progression.
No download requirements eliminate the need for local storage space, with games streaming directly from Microsoft’s servers. This feature particularly benefits users with limited device storage or slower internet connections who want to avoid lengthy installation processes.
Integration with the Xbox ecosystem provides access to achievements, friend lists, and party chat functionality regardless of which device you use for gaming. The service supports Xbox wireless controllers, third-party controllers, and touch controls for mobile devices, offering flexible input options based on your preferences and available hardware.

How To Access Xbox Cloud Gaming
Xbox Cloud Gaming requires an Xbox Game Pass Ultimate subscription, which costs $16.99 per month in the United States. This subscription includes access to the cloud gaming service plus the complete Xbox Game Pass library for console and PC gaming.
Supported devices include Android smartphones and tablets (Android 6.0 or newer), iPhones and iPads (iOS 14.4 or newer), Windows PCs, and select smart TV models from Samsung, LG, and other manufacturers. You can access the service through dedicated Xbox Game Pass apps or directly through supported web browsers.
Compatible browsers include Microsoft Edge, Google Chrome, Safari, and Mozilla Firefox on desktop and mobile platforms. Simply navigate to xbox.com/play, sign in with your Microsoft account, and begin streaming games immediately without additional software installations.
For those looking to understand how other cloud-based solutions cater to broad device compatibility and deliver cross-platform experiences, this article explains similar strategies with Amazon Web Services.
Controller management involves pairing Xbox Wireless Controllers via Bluetooth connectivity for optimal gaming experiences. Alternative controller options include third-party Bluetooth gamepads, keyboard and mouse combinations for PC gaming, and touch controls for mobile devices when controllers aren’t available.

Technical Requirements
Device Type Minimum Requirements Recommended Specifications
– Internet Speed: 10 Mbps download 20+ Mbps download
– Android Devices: Android 6.0, 2GB RAM Android 9.0+, 4GB+ RAM
– iOS Devices: iOS 14.4, iPhone 6s iOS 15+, iPhone 12 or newer
– Windows PC: Windows 10 version 1903 Windows 11, dedicated GPU
– Browser Support: Chrome 77+, Edge 79+ Latest browser versions
Internet connectivity requirements include stable broadband connections with minimum speeds of 10 Mbps for 720p streaming and 20 Mbps for optimal 1080p quality. Latency under 150 milliseconds ensures responsive gameplay, while wired ethernet connections provide superior stability compared to Wi-Fi networks.
Common technical issues include network-related stuttering, which resolves by reducing other bandwidth-consuming activities during gameplay sessions. Audio synchronization problems typically occur on older devices and improve with browser updates or switching to dedicated applications.
Troubleshooting steps involve clearing browser cache, restarting network equipment, and verifying Game Pass Ultimate subscription status through Microsoft account settings. Performance optimization includes closing unnecessary background applications and ensuring your router supports Quality of Service (QoS) prioritization for gaming traffic.
If you’re interested in the underlying infrastructure and reliability standards powering cloud services, including streaming platforms like Xbox Cloud Gaming and enterprise solutions, consider this guide on AWS for a deep dive into best practices and cloud industry benchmarks.

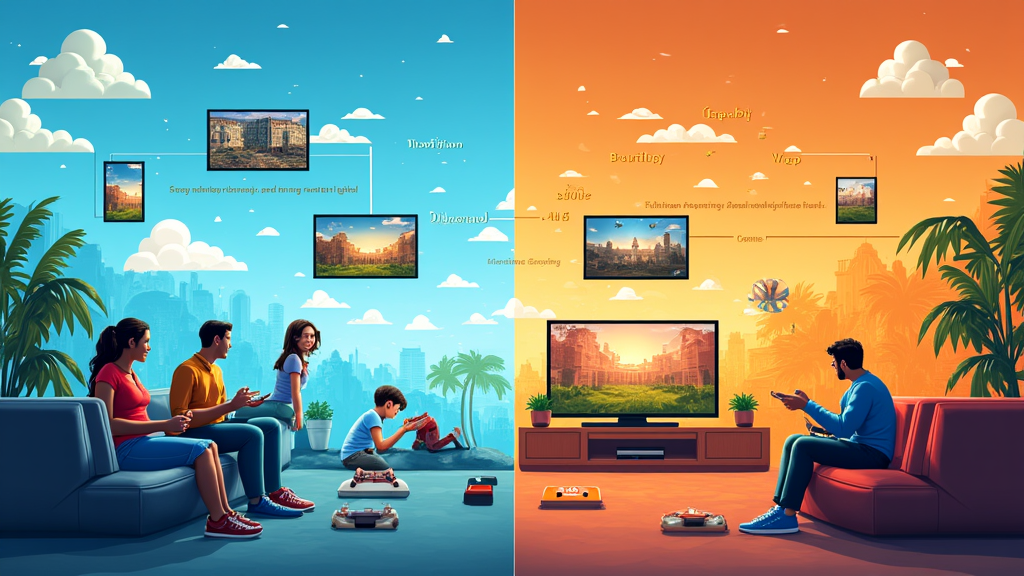
Xbox Cloud Gaming Vs. Console Gaming
Aspect Xbox Cloud Gaming Traditional Console
– Initial Cost: $16.99/month subscription $299-$499 hardware cost
– Game Library: 400+ included titles Purchase games individually
– Setup Time: Instant access Downloads required
– Device Flexibility: Multiple devices Single console only
– Performance: Internet-dependent Consistent local performance
– Storage Requirements: None 500GB-1TB needed
Performance differences include input latency variations between 30-100 milliseconds for cloud gaming compared to under 16 milliseconds for local console gaming. Visual quality remains comparable, with cloud gaming delivering 1080p resolution at 60fps while modern consoles support up to 4K resolution at 120fps for supported titles.
Flexibility advantages favor cloud gaming through multi-device accessibility and elimination of hardware upgrade requirements. You can access your games from any compatible device with internet connectivity, making it ideal for travelers or users with multiple locations.
Cost considerations reveal different value propositions depending on usage patterns. Cloud gaming offers lower upfront costs but higher long-term expenses through subscription fees, while console gaming requires significant initial investment but lower ongoing costs if you purchase games infrequently.
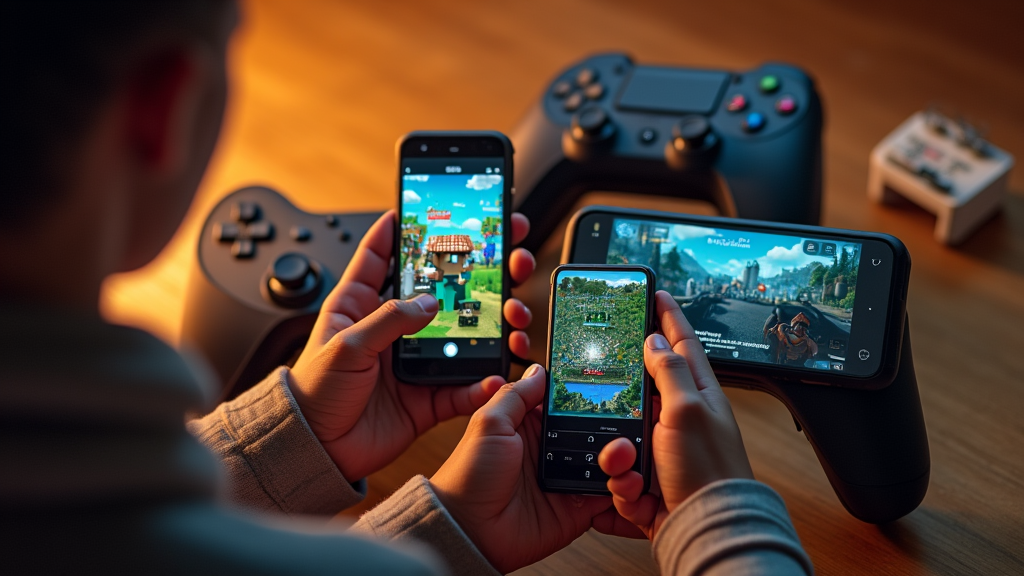
Mobile Gaming Experience
Mobile compatibility enables premium gaming experiences on smartphones and tablets that traditionally couldn’t run demanding console titles. The Xbox Game Pass mobile application provides optimized interfaces for touch controls and seamless controller connectivity through Bluetooth pairing.
Touch control benefits include immediate accessibility without requiring additional hardware purchases, making gaming possible in situations where controllers aren’t practical. Popular titles like Minecraft, Stardew Valley, and Dead Cells offer excellent touch control implementations that feel natural on mobile devices.
Physical controller advantages include precise input responsiveness essential for competitive games and complex action titles. Xbox Wireless Controllers connect effortlessly to mobile devices, providing console-quality control experiences with haptic feedback and analog stick precision.
Battery performance optimization involves adjusting streaming quality settings to balance visual fidelity with power consumption. Lower resolution streaming extends battery life significantly, while enabling battery saver modes can provide 2-4 hours of continuous gameplay on most modern smartphones.
Game Pass Integration
Game Pass enhances cloud gaming experiences by providing access to first-party Microsoft titles on their release dates without additional costs. Popular releases like Starfield, Forza Motorsport, and upcoming titles become available immediately to subscribers, eliminating $70 individual purchase requirements.
EA Play integration includes access to Electronic Arts’ catalog featuring popular franchises such as FIFA, Madden NFL, Battlefield, and The Sims. This partnership adds over 100 additional games to the cloud gaming library without requiring separate EA Play subscriptions.
Perks for cloud gamers include exclusive in-game content, early access periods for new releases, and discounted pricing on game purchases for titles you want to own permanently. Members receive 10% discounts on all Xbox game purchases and additional savings during seasonal sales events.

Performance Analysis
Streaming quality consistency depends primarily on network stability rather than device processing power. Microsoft’s upgraded server infrastructure delivers 1080p resolution at 60 frames per second for most titles, with select games supporting higher frame rates for competitive gaming advantages.
Input lag measurements typically range between 30–80 milliseconds depending on geographic distance from Microsoft’s data centers and network conditions. This latency compares favorably to many online multiplayer games where network delays already exist.
Connection quality variables include internet speed stability, network congestion during peak hours, and router quality. Dedicated gaming routers with QoS features can prioritize cloud gaming traffic, reducing competition from other household internet activities.
Recent technological improvements include adaptive bitrate streaming that automatically adjusts quality based on network conditions, ensuring consistent gameplay experiences even during temporary bandwidth fluctuations.
For a technical comparison of cloud platforms that power experiences like cloud gaming, and to learn how industry leaders like Amazon Web Services maintain performance under heavy loads, see this AWS overview.

Expert Tips For The Best Experience
– Network optimization involves using wired ethernet connections whenever possible to eliminate Wi-Fi interference and provide consistent bandwidth delivery. Position gaming devices within 10 feet of wireless routers if ethernet connections aren’t available.
– Controller setup recommendations include updating Xbox Wireless Controller firmware through the Xbox Accessories app for optimal compatibility and reduced input latency. Third-party controllers from Razer, PowerA, and 8BitDo offer excellent alternatives with similar performance characteristics.
– Data management strategies include monitoring monthly bandwidth usage since cloud gaming consumes approximately 2.25GB per hour at 1080p quality. Consider unlimited internet plans or adjust streaming quality settings to manage data consumption effectively.
– Cloud-optimized games like Microsoft Flight Simulator and Forza Horizon 5 provide enhanced experiences specifically designed for streaming platforms, offering superior performance compared to games primarily developed for local hardware.
If you want to learn more about how cloud environments support data management and network optimization for home and enterprise use, explore this detailed AWS guide.

Is Xbox Cloud Gaming Worth It?
Pros:
– Instant access to 400+ premium games without individual purchases
– Multi-device compatibility across smartphones, tablets, PCs, and TVs
– No hardware upgrade requirements or storage limitations
– Lower upfront costs compared to console gaming setups
– Seamless game progression across all supported devices
Cons:
– Internet dependency for all gaming activities
– Monthly subscription costs accumulate over time
– Input latency higher than local gaming experiences
– Limited offline gaming capabilities during connectivity issues
– Data consumption significant for users with bandwidth caps
Overall value assessment depends on individual gaming preferences and lifestyle requirements. Cloud gaming excels for casual gamers, frequent travelers, and users seeking flexible entertainment options without hardware commitments.
Ideal use cases include professional environments where traditional gaming setups aren’t practical, multi-device households sharing entertainment resources, and budget-conscious users avoiding console purchase expenses.
Comparison With Competitors
Service Monthly Cost Game Library Streaming Quality Device Support
• Xbox Cloud Gaming $16.99 400+ titles 1080p/60fps Extensive multi-platform
• NVIDIA GeForce Now $9.99-$19.99 Bring your own games Up to 4K/120fps PC, mobile, smart TV
• PlayStation Plus Premium $17.99 340+ titles 1080p/60fps PlayStation, PC
• Amazon Luna $5.99-$17.99 Channel-based 1080p/60fps Limited device support
Unique selling points for Xbox Cloud Gaming include comprehensive Game Pass integration, first-party Microsoft title availability, and extensive device compatibility across mobile and desktop platforms. The service offers superior value through bundled subscriptions that include both cloud gaming and traditional gaming library access.
Competitive advantages include immediate access to new releases, robust cross-platform progression systems, and Microsoft’s substantial cloud infrastructure investments ensuring reliable performance and global availability.

Future Of Xbox Cloud Gaming
Microsoft’s vision includes expanding global server coverage to reduce latency for international users and improve service reliability. Investment in next-generation Xbox Series X server hardware will enable 4K streaming capabilities and support for more demanding games.
Upcoming enhancements feature improved touch controls for mobile gaming, expanded smart TV application availability, and integration with Windows 11’s native gaming features. Microsoft plans to introduce variable refresh rate streaming for compatible displays and HDR content support across all supported devices.
Subscription model evolution may include tiered pricing options offering different streaming qualities, device access levels, and game library sizes to accommodate diverse user preferences and budget requirements. Partnership expansions with telecommunications providers could bundle cloud gaming access with internet service packages.

FAQ: Common Questions Answered
Q: Can I play Xbox Cloud Gaming games offline?
A: No, Xbox Cloud Gaming requires continuous internet connectivity for all gaming activities since games run on Microsoft’s cloud servers rather than your local device.
Q: What internet speed do I need for optimal performance?
A: Minimum 10 Mbps provides acceptable 720p streaming, while 20+ Mbps enables high-quality 1080p gaming with reduced buffering and improved visual clarity.
Q: Do I need to own an Xbox console to use cloud gaming?
A: No console ownership is required – Xbox Cloud Gaming works independently on smartphones, tablets, PCs, and smart TVs with Game Pass Ultimate subscriptions.
Q: Can I use non-Xbox controllers with the service?
A: Yes, most Bluetooth controllers work effectively, including PlayStation DualSense controllers, third-party gaming controllers, and mobile-specific controller accessories.
Q: Are all Game Pass games available through cloud gaming?
A: Not all Game Pass titles support cloud streaming – approximately 400 out of 500+ Game Pass games offer cloud gaming compatibility, with new titles added regularly.
Q: How much data does cloud gaming consume?
A: Data usage ranges from 1.5GB per hour at 720p to 2.25GB per hour at 1080p quality, making unlimited internet plans beneficial for frequent users.

Conclusion
Xbox Cloud Gaming transforms traditional gaming paradigms by eliminating hardware barriers and providing unprecedented accessibility across multiple devices. This comprehensive service offers exceptional value through its extensive game library, cross-platform compatibility, and seamless integration with Microsoft’s gaming ecosystem. Whether you’re seeking flexible entertainment options for business travel or evaluating cost-effective gaming solutions for your organization, Xbox Cloud Gaming presents a compelling alternative to traditional console gaming that aligns with modern digital lifestyle requirements.
If you’re also interested in learning how leading cloud computing providers like Amazon Web Services power global digital transformation and support services similar to Xbox Cloud Gaming, this guide is recommended.